library(tidyverse)

industries <- read_csv("https://raw.githubusercontent.com/cobriant/teaching-datasets/refs/heads/main/advertising.csv")5.9 Comanor and Wilson 1967
In this assignment, you will replicate the major findings of Comanor and Wilson (1967) Advertising Market Structure and Performance. The study explores how competition, market power, and barriers to entry influence profit rates across industries. When competition is high, profit rates tend to be low, indicating a healthy market where consumers benefit from prices close to marginal cost. Conversely, high profit rates suggest weak competition, allowing firms to exert market power and charge consumers a premium.
Market power often stems from barriers to entry, which make it difficult for new firms to enter and compete. For example, professions like interior design impose strict licensing requirements—such as degrees, supervised experience, exams, and certifications—that limit the number of practitioners. While these rules may seem beneficial to consumers, they primarily protect existing professionals from competition, enabling them to charge higher prices. Similarly, liquor license restrictions in cities like California create high entry costs, with licenses sometimes trading for over $100,000, shielding established bars and restaurants from new competitors.
Another key factor is product differentiation, which shapes competition and reinforces entry barriers. Advertising both reflects and enhances product differentiation by influencing consumer preferences. The study aims to explain variations in profit rates across industries by analyzing advertising intensity and the capital requirements needed to operate at minimum efficient scale.
Product differentiation is measured by cross elasticities of demand. Low cross elasticities indicate that consumers strongly prefer certain brands and are unlikely to switch in response to minor price changes. This differentiation arises from inherent product characteristics as well as firms’ past and present strategies in advertising and distribution. By examining these factors, the paper sheds light on how market structures influence profitability and competition.
Read in the Data
Run this code to read in the data set. It has Comanor and Wilson’s data for 41 industries with average profit rates and average advertising to sales ratios. It also has a variable capital_requirements which I simulated because the data for that variable was not included in the paper.
1. Hypothesis
Make some hypotheses:
- Profit is higher for industries where the advertising to sales ratio is (highest/lowest).
- Profit is higher for industries where capital requirements are (highest/lowest).
Answer:
2. Ggplot Visualizations
Here’s a plot using geom_col() comparing the profit rates of all industries.
industries %>%
  mutate(industry = reorder(industry, profit_rate)) %>%
  ggplot(aes(x = industry, y = profit_rate)) +
  geom_col() +
  coord_flip()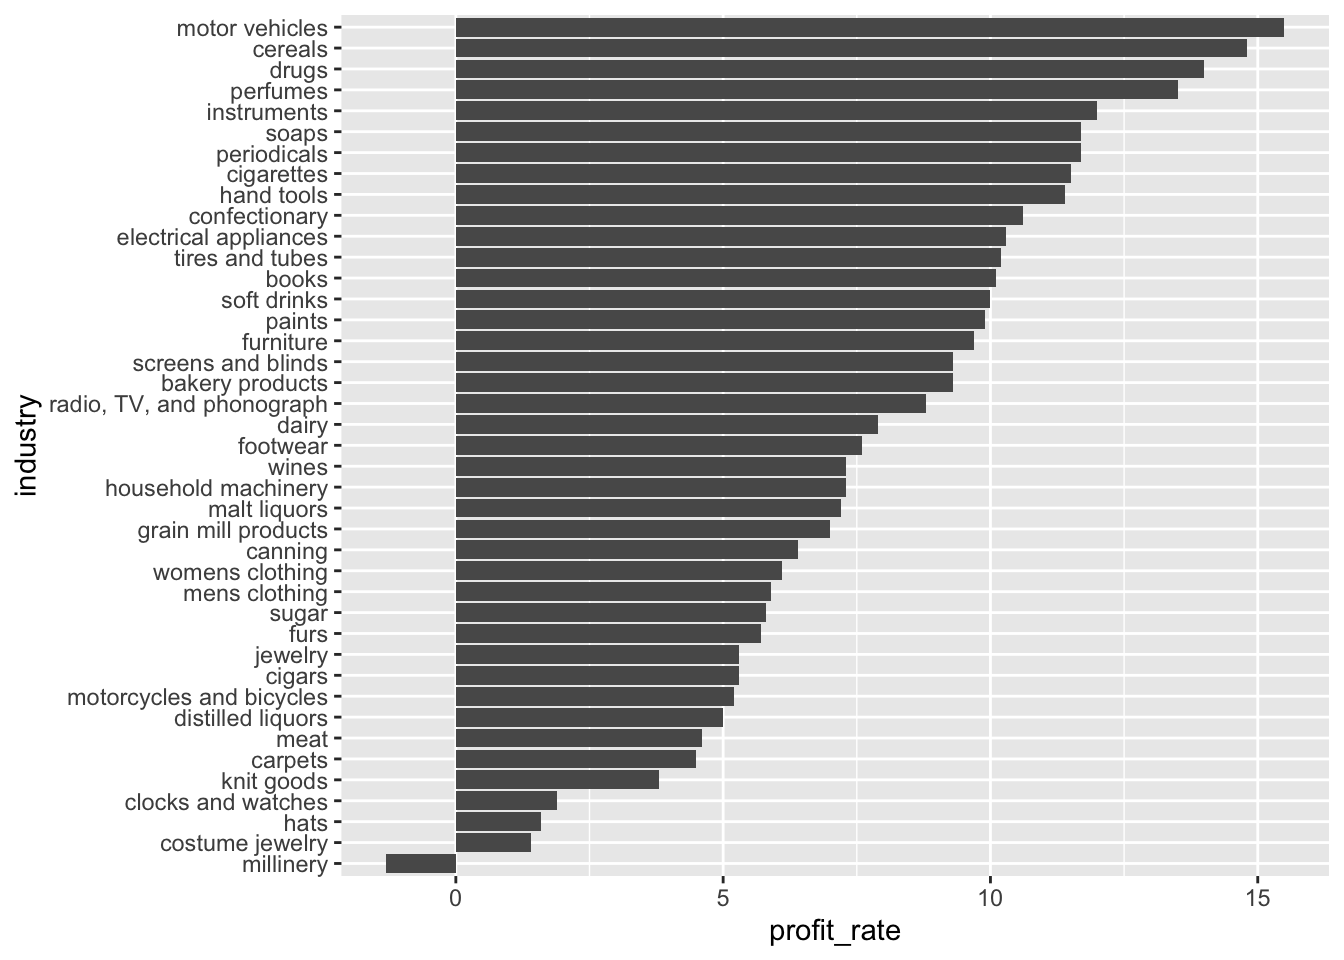
- Which industries have the highest and lowest profit rates?
Answer:
Highest profit rates: Lowest profit rates:
- Draw a plot comparing the advertising to sales ratio of all industries. Let advertising be descending. Which industries have the highest and lowest advertising ratios?
Answer:
Highest advertising: Lowest advertising:
- Draw a scatterplot to show the effect of advertising on profit rates. Add a line of best fit.
Answer:
Higher advertising indicate (higher/lower) profits for industries.
- Draw a scatterplot to show the effect of capital requirements on profit rates. Add a line of best fit.
Answer:
Higher capital requirements indicate (higher/lower) profits for industries.
3. Linear Model
Use lm to fit the linear model profit_rate ~ advertising_sales_ratio + capital_requirements. Then interpret the results.
Answer:
# industries %>%
#   lm(___) %>%
#   broom::tidy()
Interpretation: holding constant capital requirements, when the advertising to sales ratio increases by 1, profit increases by , and the effect (is/is not) statistically significant (p-value less than .05). Holding constant advertising to sales, when the capital requirements increase by 1, profit increases by , and the effect (is/is not) statistically significant (p-value less than .05).